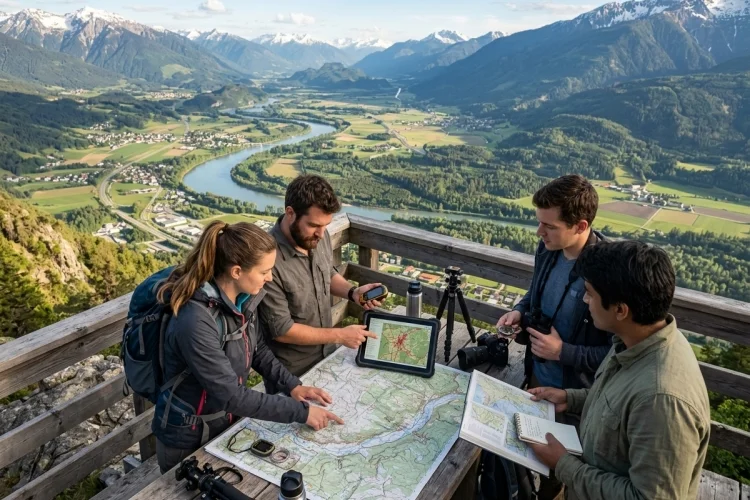
Think about the last time you used a map. Maybe you were finding a restaurant, checking a hiking route, looking at weather patterns, or simply trying to understand where one country sits in relation to another.
Maps seem ordinary, but they are powerful tools for turning complicated information into something we can see. Understanding how maps help us understand places, people, and environments is an important part of geography.
Maps can show where things are located, how far apart they are, what physical features shape an area, where people live, and how places change over time.
National Geographic describes maps as representations of selected characteristics of a place, usually drawn on a flat surface. Reading them involves skills such as understanding symbols, scale, projection, grids, latitude, and longitude.
Modern digital mapping goes even further. Geographic Information Systems, or GIS, can combine different layers of data to reveal relationships between people, places, and environments.
In other words, maps do much more than tell us where to go.
1. Maps Show Where Places Are Located
The most obvious job of a map is showing location.
A map can help you find a city, river, mountain range, road, country, or neighborhood. But location is not simply about identifying a dot on a page. Maps also help us understand where one feature is positioned in relation to another.
Suppose you are looking at a map of Europe. You can quickly see that France is west of Germany, Italy extends into the Mediterranean, and the United Kingdom lies across the English Channel from continental Europe.
This ability to understand relative position is part of spatial thinking. National Geographic describes spatial thinking as the ability to understand and analyze phenomena connected with places and spaces.
Latitude and longitude can provide even more precise locations. Instead of saying that a place is “somewhere in northern Africa,” coordinates can identify a specific position on Earth’s surface.
Maps therefore give geography a shared visual language for answering a basic question:
Where is it?
2. Scale Helps Us Understand Distance
A map cannot usually show an area at its real size.
Imagine trying to carry a life-size map of an entire country. It would not be very useful.
That is why maps use scale.
Scale represents the relationship between distance on the map and distance in the real world. National Geographic identifies scale as one of the basic elements needed to understand and create maps.
For example, one centimeter on a map might represent one kilometer on the ground.
This allows map users to estimate how far apart two places are.
A city may look close to a national park on a small map, but measuring the distance using the scale could reveal that they are actually hundreds of kilometers apart.
Scale also changes how much detail a map can show. A map of your neighborhood may display individual streets and buildings, while a world map cannot realistically include every local road.
Understanding scale helps prevent us from treating every map as though it shows the same level of detail.
3. Symbols Turn Complex Places Into Readable Information
Imagine a map that tried to draw every tree, building, river, railway, and road exactly as it appears in real life.
It would quickly become impossible to read.
Maps solve this problem with symbols, colors, lines, and labels.
A blue line may represent a river. A certain type of line might show a road or boundary. Small symbols can identify schools, airports, campsites, or other features.
The legend, sometimes called a key, explains what those symbols mean.
USGS educational material identifies basic map components such as a legend, scale, and north arrow as important features for creating and interpreting useful maps.
This use of symbols is one reason maps are so efficient. A large amount of geographic information can be compressed into a relatively small space.
However, symbols should always be interpreted through the legend rather than guessed. Different maps can use different visual systems depending on their purpose.
4. Physical Maps Help Us Understand the Environment
Some maps focus mainly on the natural environment.
They might show mountains, rivers, valleys, coastlines, lakes, deserts, forests, or elevation.
Topographic maps are particularly useful for understanding the shape of the land. The U.S. Geological Survey explains that topographic maps use contour lines to represent elevation and show the three-dimensional shape of terrain on a two-dimensional surface.
Contour lines that are close together generally indicate a steep change in elevation, while lines spaced farther apart indicate gentler terrain.
This information can be useful for hikers, engineers, scientists, emergency planners, and anyone studying landscapes.
Environmental maps can also help us understand relationships.
For example, a map might show how rivers pass through valleys, where settlements exist near coastlines, or how mountains create barriers between regions.
Maps therefore help turn physical geography into visible patterns rather than disconnected facts.
5. Thematic Maps Reveal Patterns About People
Not every map focuses on mountains and roads.
A thematic map is designed to communicate information about a particular subject or theme.
Population is a good example.
The U.S. Census Bureau provides interactive maps that allow users to explore demographic, population, housing, and economic information geographically.
Imagine looking at population density across a country.
Instead of reading a table containing hundreds of numbers, a map can make areas of high and low population density immediately visible.
You might notice that some major cities contain very dense populations while mountainous, desert, or remote regions have far fewer people.
Maps can also display patterns involving age, housing, migration, income, languages, or other demographic characteristics when appropriate data are available.
The Census Bureau has even used thematic maps to help students investigate how geography relates to population growth and migration.
That makes maps powerful tools for human geography.
6. Maps Help Us See Connections Between People and Environments
One of the most interesting uses of mapping happens when human and environmental information are considered together.
Imagine placing several map layers over the same area:
One shows rivers.
Another shows roads.
Another shows population.
Another shows flood-prone zones.
Comparing these layers can reveal relationships that would be difficult to notice from separate tables.
This is one of the strengths of GIS, or Geographic Information Systems. National Geographic explains that GIS can evaluate relationships among objects, people, and places across space and time.
For example, GIS could help investigate whether communities are located near water sources, how transportation networks connect population centers, or which settlements may face environmental hazards.
This does not automatically prove that one geographic factor caused another.
But mapping can reveal patterns worth investigating.
That is why spatial analysis is used across fields such as geography, environmental science, urban planning, public health, and emergency management.
7. Historical Maps Show How Places Change
Maps do not only show what the world looks like now.
Historical maps can help us investigate what places looked like decades or even centuries ago.
The Library of Congress Geography and Map Division provides access to extensive digital collections containing historical maps as well as more recent cartographic and geospatial materials.
Imagine comparing a city map from 1900 with one from today.
You might notice that farmland has become neighborhoods, new roads have appeared, railways have disappeared, or the city has expanded far beyond its earlier boundaries.
Historical maps can also provide evidence about political boundaries, transportation routes, land ownership, exploration, settlement, and changing land use.
The Library of Congress notes, for example, that historical maps can be used to investigate how individual properties and surrounding land were used over time.
Maps therefore become historical evidence as well as geographic tools.
8. Different Maps Answer Different Questions
There is no single “best map.”
The best map depends on what you are trying to understand.
If you want to drive somewhere, a road map is useful.
If you want to examine mountains and elevation, a topographic map is much better.
If you are studying population patterns, you might choose a thematic demographic map.
If you want to investigate changes in city boundaries, historical maps may be the most useful option.
USGS teaching resources use both topographic and thematic maps to explore the physical and cultural geography of different parts of Earth.
This means good map reading begins with a question:
What information was this map designed to show?
Always check the title, legend, scale, source, date, and other available information before drawing conclusions.
A map created for navigation may leave out details that would be essential for environmental research, while a population map may simplify physical landscapes.
Maps are selective representations, not perfect copies of reality.
9. Digital Maps Let Us Explore Geographic Data in New Ways
Traditional paper maps remain useful, but digital maps have transformed how people interact with geographic information.
A digital map can be zoomed, searched, updated, and connected with large datasets.
The U.S. Census Bureau’s interactive mapping tools, for example, allow users to view demographic information at multiple geographic levels rather than relying on a single static image.
GIS tools can also switch layers on and off.
You might start with a base map, add population density, then overlay transportation networks or environmental features.
National Geographic’s MapMaker educational resources describe maps as tools for visualizing complex datasets, solving problems, analyzing information, and telling geographic stories.
This makes modern mapping interactive.
Instead of simply asking “Where is this place?” we can ask:
“Why might people live here?”
“How has this area changed?”
“What environmental features surround it?”
“What geographic patterns can we see?”
Those questions bring maps much closer to genuine geographic investigation.
Understanding how maps help us understand places, people, and environments changes the way we look at geography.
Maps show location and distance, represent landforms, reveal population patterns, document historical change, and help us explore relationships between human communities and their surroundings.
Different maps answer different questions, which is why good map reading requires more than simply looking at shapes and colors. Pay attention to the title, scale, symbols, legend, data source, and purpose of the map.
Digital mapping and GIS make this even more powerful by allowing multiple types of geographic data to be analyzed together.
Try opening a map of your own area today. Look beyond the roads and ask what it reveals about the landscape, population, environment, and connections between places.